
Interest rates and currency moves could be pointing to the beginning of a long comeuppance. Are government debt loads starting to matter?
Federal debt held by the public reaches 101% of GDP in fiscal 2026. The Congressional Budget Office projects it hits 107.7% in 2030 — surpassing the 106.1% record set in 1946 — then 120% by 2036 and 175% by 2056.
The 1946 figure was the price of defeating Germany and Japan. This one is the price of an ordinary Tuesday.
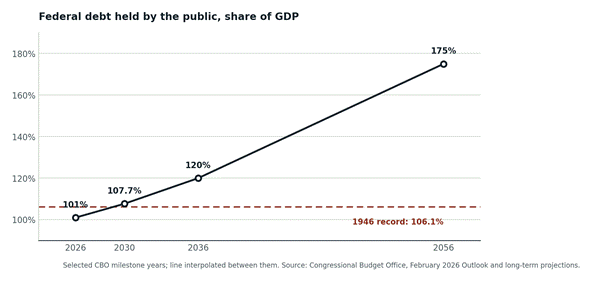
Interactive version: longtermtrends.com/us-debt-to-gdp
DEBT WON’T GO DOWN THIS TIME
The 1946 debt fell because the thing causing it stopped. Nothing is scheduled to stop this time.
That debt was terminal. The war ended, spending collapsed from roughly 40% of GDP to single digits, and the ratio fell for three decades on the back of a baby boom, 4% real growth, a rebuilt world buying American goods, and a Federal Reserve that capped bond yields by fiat. Debt was retired by growth and repression, not austerity — but it was retired.
Today’s debt is structural and accelerating. CBO puts the fiscal 2026 deficit at 5.8% of GDP against a 50-year average of 3.8% — with unemployment low, no war, and no recession. The primary deficit (before interest) is 2.6% of GDP. This is the good part of the cycle.
And the demographics run the opposite direction from 1946. There were 5.1 workers per Social Security beneficiary in 1960. There are about 2.7 today. By 2045 there will be roughly 2.2.
THE OFF-BALANCE SHEET DEBTS ARE BIGGER
The $39 trillion of debt outstanding is the part Washington has already borrowed. It is the smaller number.
| Obligation (75-year present value) | Amount |
|---|---|
| Social Security (OASDI) unfunded obligation | $29.3 trillion |
| Medicare Hospital Insurance (Part A) unfunded obligation | $4.2 trillion |
| Treasury’s accrual measure of Social Security + Medicare shortfall (SOSI, FY2025) | $88.4 trillion |
| Annual fiscal gap—permanent tax hike or spending cut needed to stabilize debt | 4.7% of GDP |
Two details deserve attention. First, the Social Security number moved $4.2 trillion worse in a single year — from $25.1 trillion in the 2025 Trustees Report to $29.3 trillion in 2026 — driven by downgraded fertility and immigration assumptions. That is a 16% deterioration in twelve months in a program that is supposed to be actuarially projected.
Second, Treasury’s own audited Financial Report says that under current policy, debt reaches 576% of GDP by 2100. That is not a warning from a think tank. That is the government’s accountants.
The Trustees quantify the fix. To close Social Security’s 75-year gap immediately requires raising the payroll tax from 12.4% to 16.65%, or cutting all scheduled benefits by 25.2%, starting now and permanently. Medicare Part A requires its payroll tax to go from 2.9% to 3.46%, or a 12% benefit cut.
Nobody is proposing either.
THREE DATES ALREADY WRITTEN INTO LAW
These aren’t forecasts. They are what current statute does when the trust funds run dry:
| Date | Event | Automatic consequence |
|---|---|---|
| Q4 2032 | Social Security retirement fund (OASI) depleted | 22% benefit cut |
| Q2 2033 | Medicare Hospital Insurance depleted | 11% cut to hospital payments, rising to 16% by 2040 |
| Q3 2034 | Combined OASDI depleted | 17% benefit cut, rising to 35% by 2100 |
Congress will not permit a 22% cut to 71 million voters. It will borrow instead. Which means these dates are better read as forced borrowing events than as benefit cuts.
INTEREST IS THE TELL
The abstract argument became a cash expense.
- Net interest hits $1.039 trillion in fiscal 2026 — 3.3% of GDP, past the 3.2% post-WWII high set in 1991.
- That consumes 18.6% of all federal revenue. Roughly one dollar in five arrives and immediately leaves.
- Interest now exceeds spending on national defense ($947B), Medicaid ($708B), and veterans’ benefits ($435B). Only Social Security is larger.
- CBO’s path: $2.1 trillion by 2036, $16.2 trillion cumulative over the decade — more than the entire national debt in 2020.
The Committee for a Responsible Federal Budget’s analysis of CBO’s 2026 baseline finds the average interest rate paid on the debt could exceed nominal GDP growth beginning in FY2031. That is the line that matters. Below it, debt is a manageable ratio. Above it, debt compounds on itself and the only exits are inflation, taxation, or default.
THE RISKS
- r exceeds g. Once the average cost of debt tops nominal growth, stabilization requires primary surpluses the U.S. has not run since 2001.
- The buyer base has changed. GAO reports the largest auction buyers are now domestic investment funds, money market funds, and hedge funds — price-sensitive investors, not central banks parking reserves. In July 2026 a 30-year auction cleared at 5.058%, the highest yield since 2007.
- Inflation is the path of least resistance. Every other option requires a vote.
- Fiscal dominance. When debt service is 20% of revenue, the political cost of Fed tightening rises sharply.
- No dry powder. Starting the next recession at 105%+ of GDP means the countercyclical response is either smaller or far more expensive.
- Reform will be abrupt, not gradual. History says Congress acts at the cliff edge, which means the adjustment arrives as a shock rather than a glide path.
TWO PLACES TO BE CAREFUL
Businesses whose revenue is a line item in the federal budget. Hospital operators, Medicare Advantage plans, dialysis and post-acute providers. When the reckoning comes, provider reimbursement is the politically cheapest lever — cutting what hospitals are paid is invisible to voters in a way that cutting grandmother’s check is not. Many of these operators also carry meaningful leverage, so a reimbursement squeeze and a higher cost of capital arrive together. The 2033 statutory cut is the floor case, not the risk case.
Long-duration bond proxies with permanent external funding needs — regulated utilities and net-lease REITs in particular. These are valued as a spread over the long bond and must return to the debt market continuously to fund rate base or acquisitions. A structurally higher term premium raises the discount rate and the cost of capital simultaneously, while allowed returns and contractual rent escalators adjust with a multi-year lag. Business quality doesn’t rescue you here; the arithmetic of the denominator does the damage.
IS THIS TIME DIFFERENT?
Calls for a debt disaster have been wrong for 40 years. Japan crossed 250% of GDP without a funding crisis. The dollar’s reserve status buys the U.S. an enormous, genuinely valuable exemption. And nobody — including CBO — can tell you the threshold.
So the conclusion isn’t “short America.” It’s narrower and more defensible: avoid owning assets whose value depends on long rates staying low, and avoid owning businesses whose revenue depends on a government eventually being able to afford them. Depending on permanently low interest rates is an asymmetric bet in the wrong direction, as in, “Heads I win little, tails I lose.”
SOURCES
- Congressional Budget Office, The Budget and Economic Outlook: 2026 to 2036 (February 2026)
- 2026 OASDI Trustees Report and 2026 Medicare Trustees Report (June 9, 2026)
- U.S. Treasury, Financial Report of the U.S. Government, FY2025
- Committee for a Responsible Federal Budget, analyses of the 2026 Trustees Reports and CBO baseline
- American Action Forum; Peter G. Peterson Foundation, interest cost projections
- GAO-26-107529, Federal Debt Management (March 2026)
- Bloomberg, 30-year Treasury auction result, July 9, 2026
About the Author

Neil Rose, CFA, is the founder and CEO of Regency Capital Management.