|
This letter looks at three connected developments: the market’s concentration in technology, the pressure rising interest rates are putting on stocks and the economy, and the changing role of bonds in a diversified portfolio. The common thread is managing risk around our objectives rather than trying to predict the market’s next move.
Technology stocks hit another gear in the first half of 2026, especially semiconductors and other AI-related industries. Since June, however, signs of exhaustion have appeared (though we have seen corrections quickly reverse to new highs before).
This latest check on a historic bull market may be more serious. The biggest of Big Tech have stalled, and many of the biggest AI winners have corrected, halved, or worse. More conspicuous than the price action this time is a worrisome surge in interest rates and the fiscal cancer driving it. More investors are asking whether compounding deficits, debt, and money printing have become irreversible, and the prognosis has turned grimmer.
Macro threats are easy enough to diagnose; most are understood in expert detail. Knowing what comes next, and when, is nearly impossible. No one has forecast it reliably. So what follows is not a forecast or an implied claim that I can see around corners. I can’t. No one can.
But seeing around corners isn’t required to invest successfully, especially over the long term and in service of real financial objectives: avoiding permanent capital loss, having more than enough for a long and happy retirement, protecting against inflation, tax efficiency, liquidity, growth, and more.
A 160 IQ isn’t required either (I’ve never taken an IQ test, and I’m sure my score wouldn’t impress). No needles need threading. Just a handful of things need doing:
- Don’t be stupid. Mistakes are inevitable, but we can’t make colossal ones.
- Avoid permanent capital loss. Be conservative. It’s no coincidence that history’s most successful investors consistently work to reduce risk. There are no old gunfighters.
- Watch emotions and biases. Fight the human tendency to get in our own way.
- Mind the big picture. Don’t forecast; think in probabilities.
- Count the cash, not the crowd. Fundamentals matter.
- Learn, learn, learn. Learning is a superpower too few bother to use.
This is old hat, I know, but it seems worth belaboring (if only for my own benefit) to keep a first-principles mindset in extraordinary times of elevated prices and vulnerability.
Instead of a forecast, I offer a way to think about the odds of an inflection point, where the balance of risk and reward shifts. Inflection points are opportunities to add protection against whatever most investors have become exposed to. They are also opportunities to buy long-neglected bargains.
What follows isn’t a complete account of our investment work today, but it touches on the main forces at work in portfolios.
The only game in town
It’s useful to see the market as it is, not as we want it to be. Prices reflect, in real time, the decisions of millions of participants putting trillions of their own dollars on the line. Surveys and polls can misread public opinion. Elections often confound the polls. New Coke was an instant flop, even though taste tests and focus groups favored it.
Market prices show what buyers and sellers are willing to pay now. They may reflect short-term thinking or prove wrong tomorrow, but they are prices you can actually trade at today, not opinions expressed in a survey.
Follow the money, and the market’s preference is clear: it places ever more value and hope in American technology and less in everything else. That concentration ties the market’s potential gains and risks increasingly to Big Tech. To the market, it’s the only game in town.
Big Tech and its large semiconductor and AI-related siblings keep distancing themselves, even decoupling, from the rest of the stock market. They certainly haven’t flattered our own results lately. Today, the de facto technology sector (Information Technology and Communication Services, plus Amazon and Tesla, which are classified elsewhere but are technology companies in all but name) makes up roughly 55% of the S&P 500’s total value. The ten largest U.S. stocks, all technology and internet companies, are each worth more than a trillion dollars ($28 trillion combined) and account for 40% of the S&P 500’s value, both records. The top five are worth more than the bottom 434 combined, and every S&P 500 member is a large company by any measure: entry now requires a market value of about $20 billion.
The top three (Nvidia, Apple, and Alphabet) are together worth more than all of Europe’s stocks as measured by MSCI, even though Europe and the U.S. have roughly the same GDP (about $32 trillion). The fourth-largest company, Microsoft, is worth more than the entire S&P 500 Energy sector: every oil, gas, and coal company combined.
Semiconductor and semiconductor-equipment stocks are now 12% of the S&P 500, double their weight at the start of 2026. The semiconductor complex is worth more than the Financials sector (which includes the $1.1 trillion Berkshire Hathaway) or the Health Care sector, and three times the Energy sector.
None of this means the market is crazy or necessarily wrong. The biggest reason is earnings: unlike the technology run of a quarter-century ago, today’s technology leaders are massively profitable. The top 10 stocks account for about 40% of S&P 500 profits, and those profits are growing faster than the rest of the market’s.
Behind that growth are colossal macro forces, including fiscal and monetary policy, that may matter more to the market’s future than anything else. (More on this shortly.)
A long stretch of low interest rates (including years at 0%), record deficit spending, and once-unthinkable money printing created economic and market sea changes that are still being digested around the world. When policymakers pushed rates to levels never seen before, they replaced Adam Smith’s invisible hand and gutted the time value of money, which interest rates represent. Savers were punished, and risk-taking was rewarded.
Debtors took on more debt, and investors reached for more speculative investments. When safe assets yield nothing, anything with a higher yield looks attractive. Under the Zero Interest Rate Policy (ZIRP), demand for high-yield (“junk”) bonds spiked and their yields fell so far that “high yield” became a misnomer. As James Grant of Grant’s Interest Rate Observer observed at the time, there was no high yield anymore, just yield.
As rates fell, bond investors also took more risk, buying longer-term issues and lending to borrowers with questionable credit. Bond investing became a game of picking up nickels in front of a steamroller.
Low interest rates also fueled speculation because growth itself commands a bigger premium. An adage I’ve never liked comes to mind: a bird in the hand is worth two in the bush. The trouble is that it assumes both the number of birds (two) and the timing (now, or soon enough). In reality, you don’t know how many birds are in the bush or how soon you can get them.
Suppose a bird’s only value is the food it provides. Falling interest rates are like a shrinking bird, and ZIRP is a bird too small to feed anyone. You’d gladly trade your tiny bird for whatever is in the bush and risk waiting longer to get it. High interest rates, by contrast, are like holding a chicken. You’d be far less willing to trade it blind; you’d want assurances about what’s in the bush and how soon you could get it.
When banks paid nothing and bonds offered little, promises of growth became far more appealing. In hindsight, ZIRP helped push money into higher-risk, higher-return propositions such as Tesla, SpaceX, Uber, and Bitcoin. It also funded speculative bets that lost everything, including WeWork, Nikola, FTX, Theranos, and countless crypto projects. Remember meme coins and NFTs (non-fungible tokens)?
Stimulus ultimately “worked.” As Oscar Wilde put it, “Nothing succeeds like excess.” Asset prices recovered, and the stock market surged as “temporary” government support became indefinite. Companies found willing buyers for new debt and stock. Venture capital, private equity, and private credit expanded dramatically, supplying abundant funding and reducing some companies’ need for IPOs and public markets. That funding let investors overlook years of losses totaling billions of dollars, giving some moonshots the capital and time to become trillion-dollar companies.1
The bond vigilantes return
The unsustainable is, at last, looking less sustainable. A check on the excess, speculation, and government profligacy has arrived in the form of an escaped convict now on the loose: the bond vigilante.
In the early 1990s, political strategist James Carville famously said that if he were reincarnated, he’d want to come back as the bond market, because “you can intimidate everybody.” A generation of investors has never experienced interest rates set by anything close to free-market forces, where bonds are sold off in protest of fiscal and monetary policies seen as inflationary or imprudent.
Between October 1993 and November 1994, the 10-year Treasury yield rose from 5.2% to 8.0% as the bond vigilantes (that is, the market) grew worried about deficit spending and “Hillarycare.” They were soothed when Republicans swept the 1994 midterm elections and took control of the House for the first time in 40 years.
Democrats and Republicans then worked together to reduce the deficit. By the fall of 1998, four years later, the 10-year yield had fallen to around 4%, and the U.S. was running budget surpluses.
The bond vigilantes eventually went quiet somewhere between “The Maestro” (Fed Chair Alan Greenspan), Y2K and the dot-com crash, the Great Financial Crisis, and the Federal Reserve’s expanded role. Worries shifted to deflation and a repeat of the 1930s.
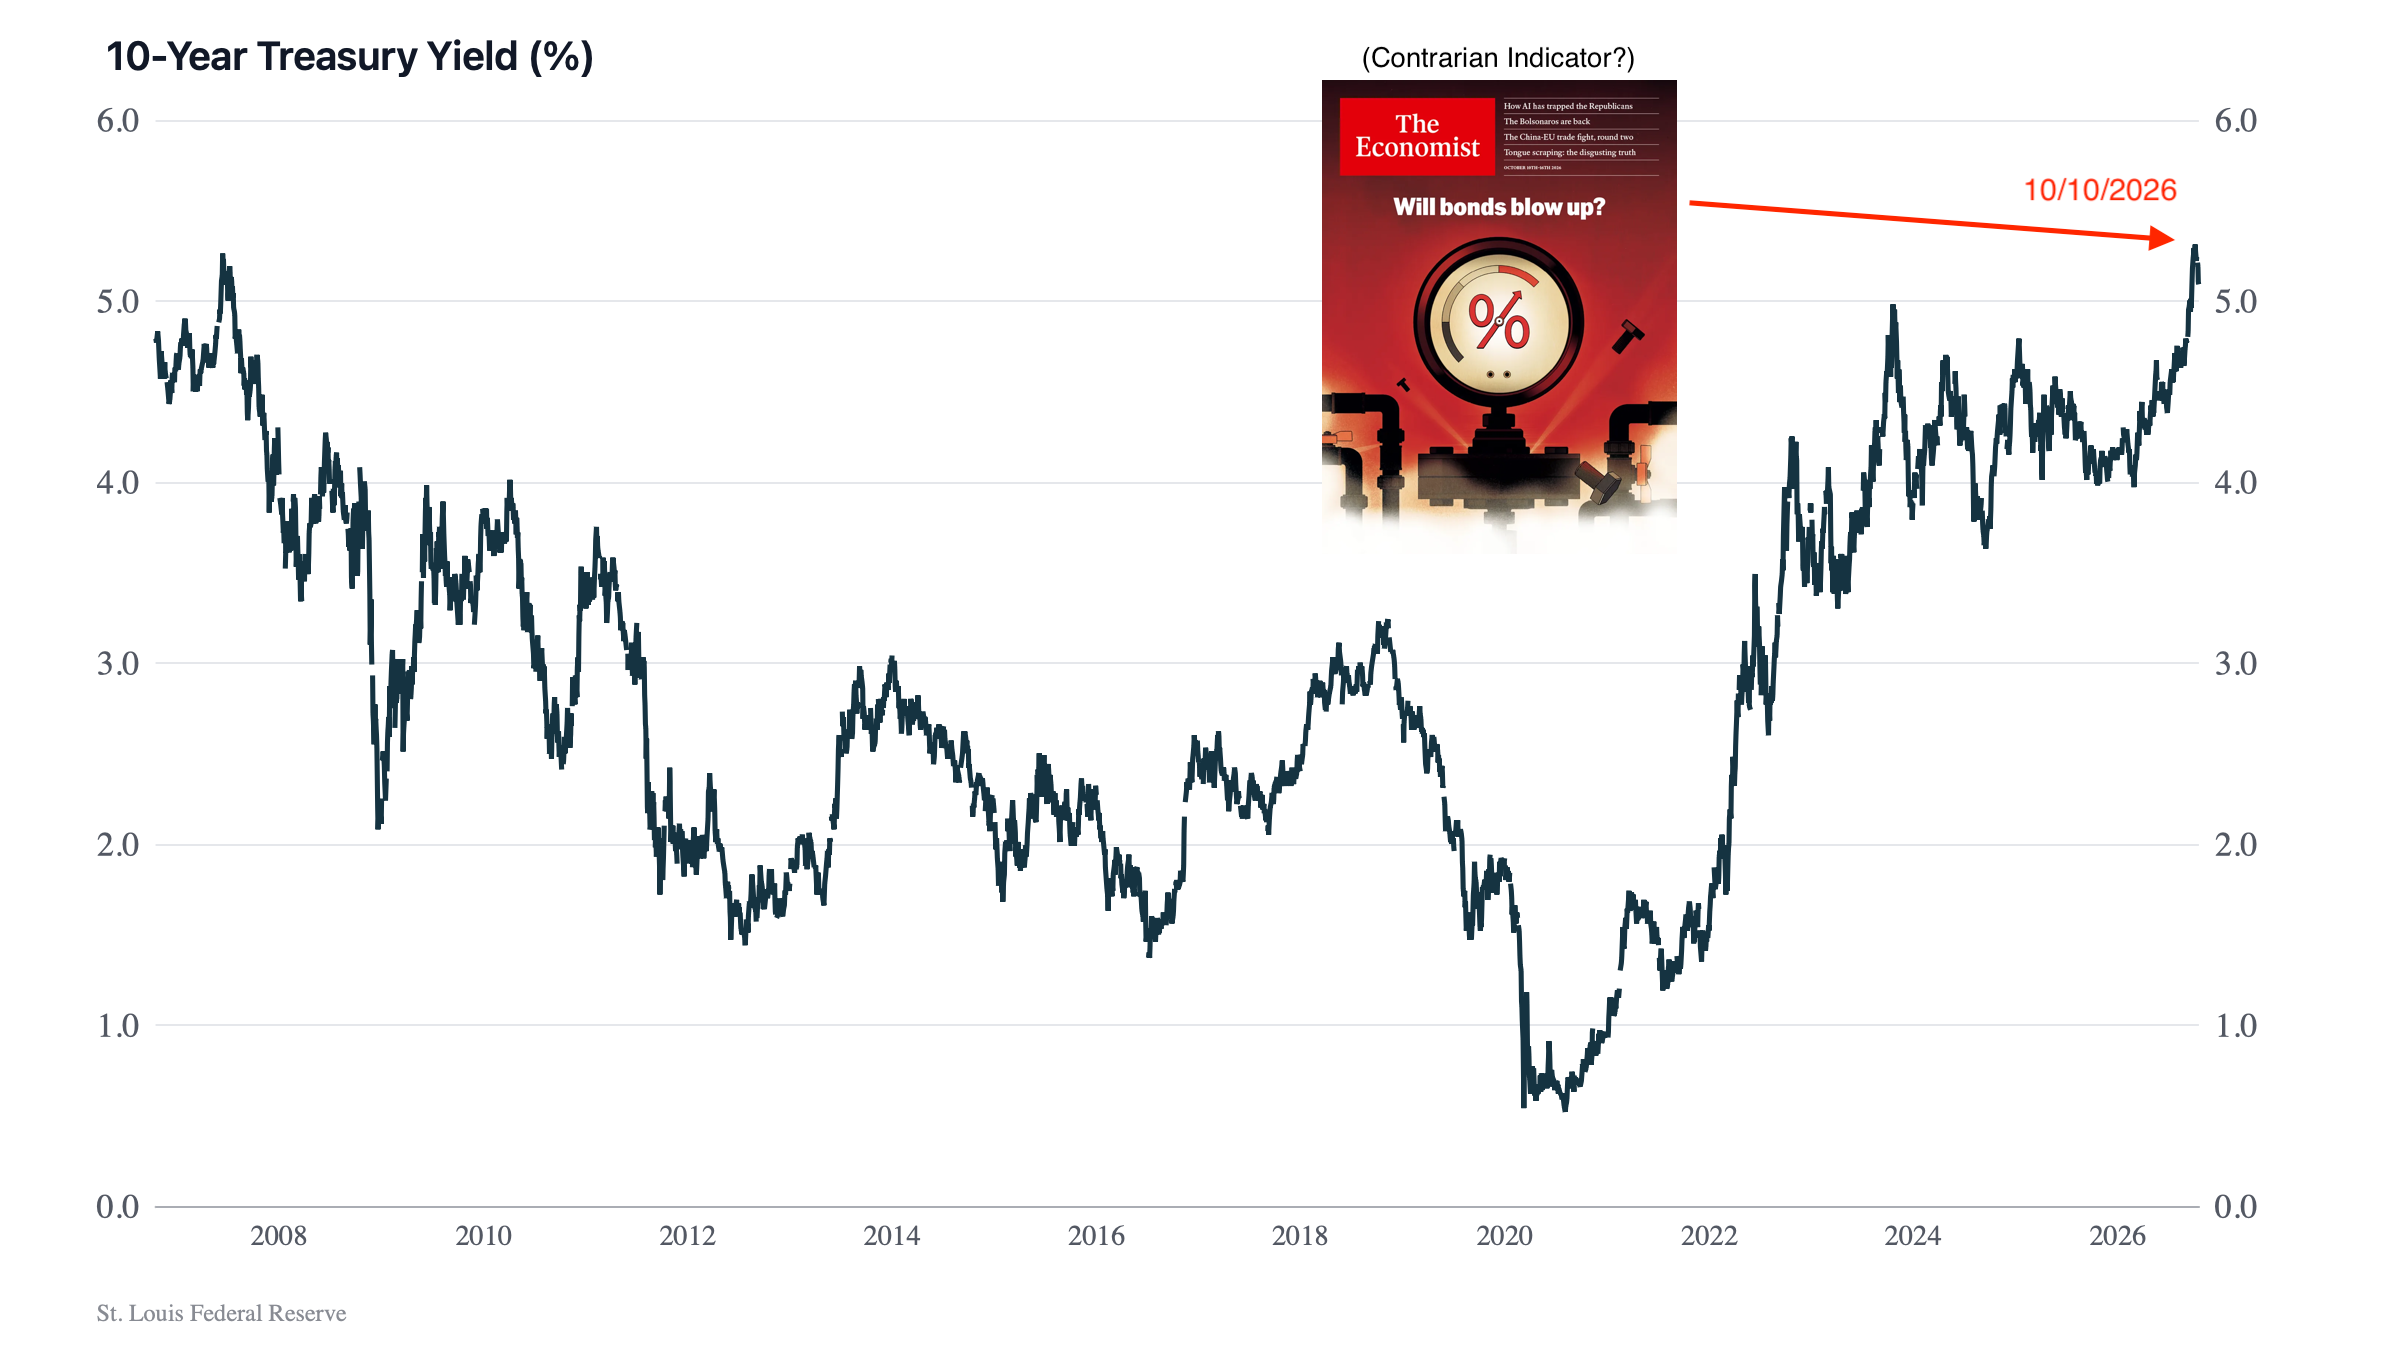
The bond vigilantes may be back. Interest rates are climbing again. The 10-year Treasury yield recently broke above 5% and reached its highest level since 2002. The bird is fattening, and that’s a problem for a market betting more and more on the bush.
Higher rates from here are a risk to stocks and possibly the economy. The housing market is freezing. Homebuilder and home-improvement stocks are at multi-year lows. America’s housing shortage has worsened because new construction keeps lagging new household formation.
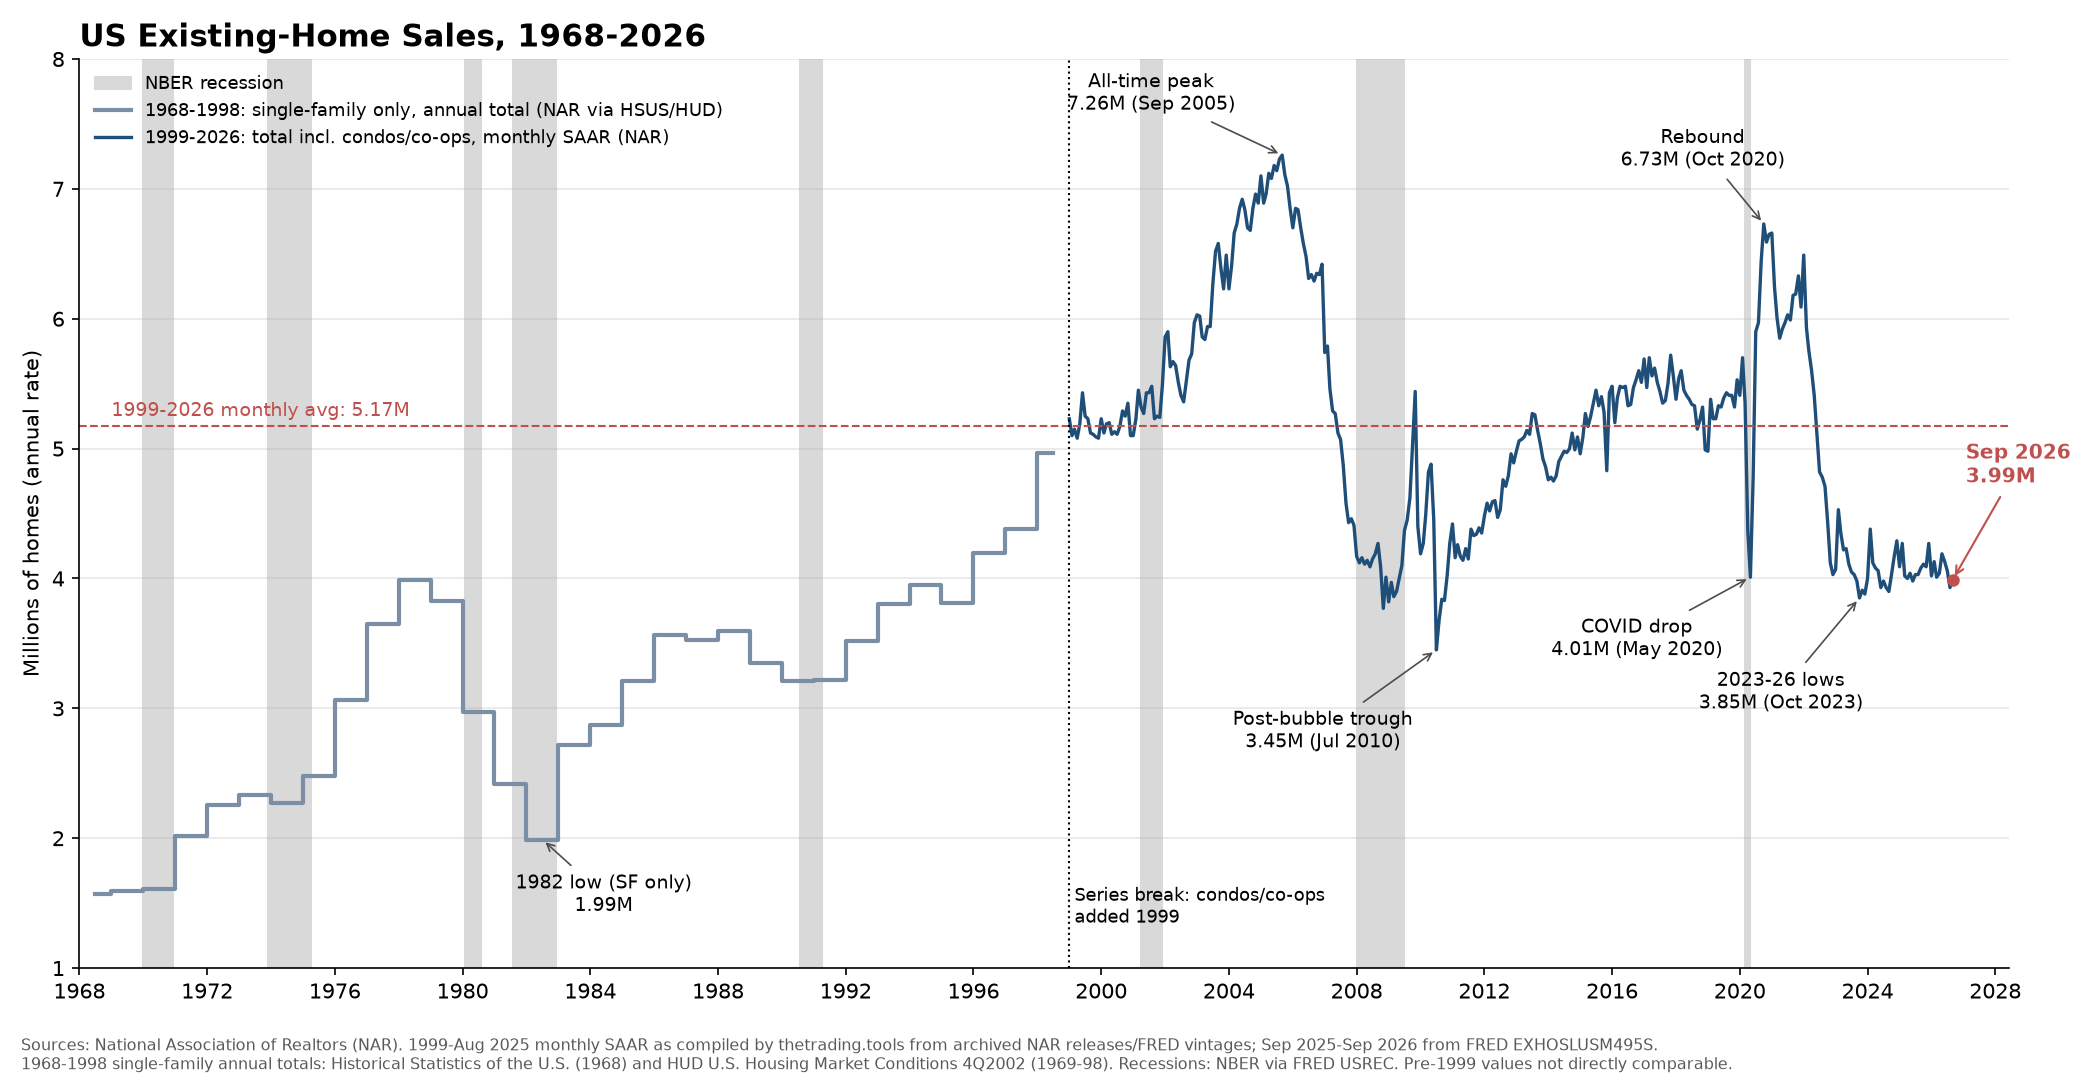
Existing-home sales have fallen to levels last seen in the 1980s. That’s worse than it looks on a chart, because condos weren’t counted in home-sales statistics before 1999.
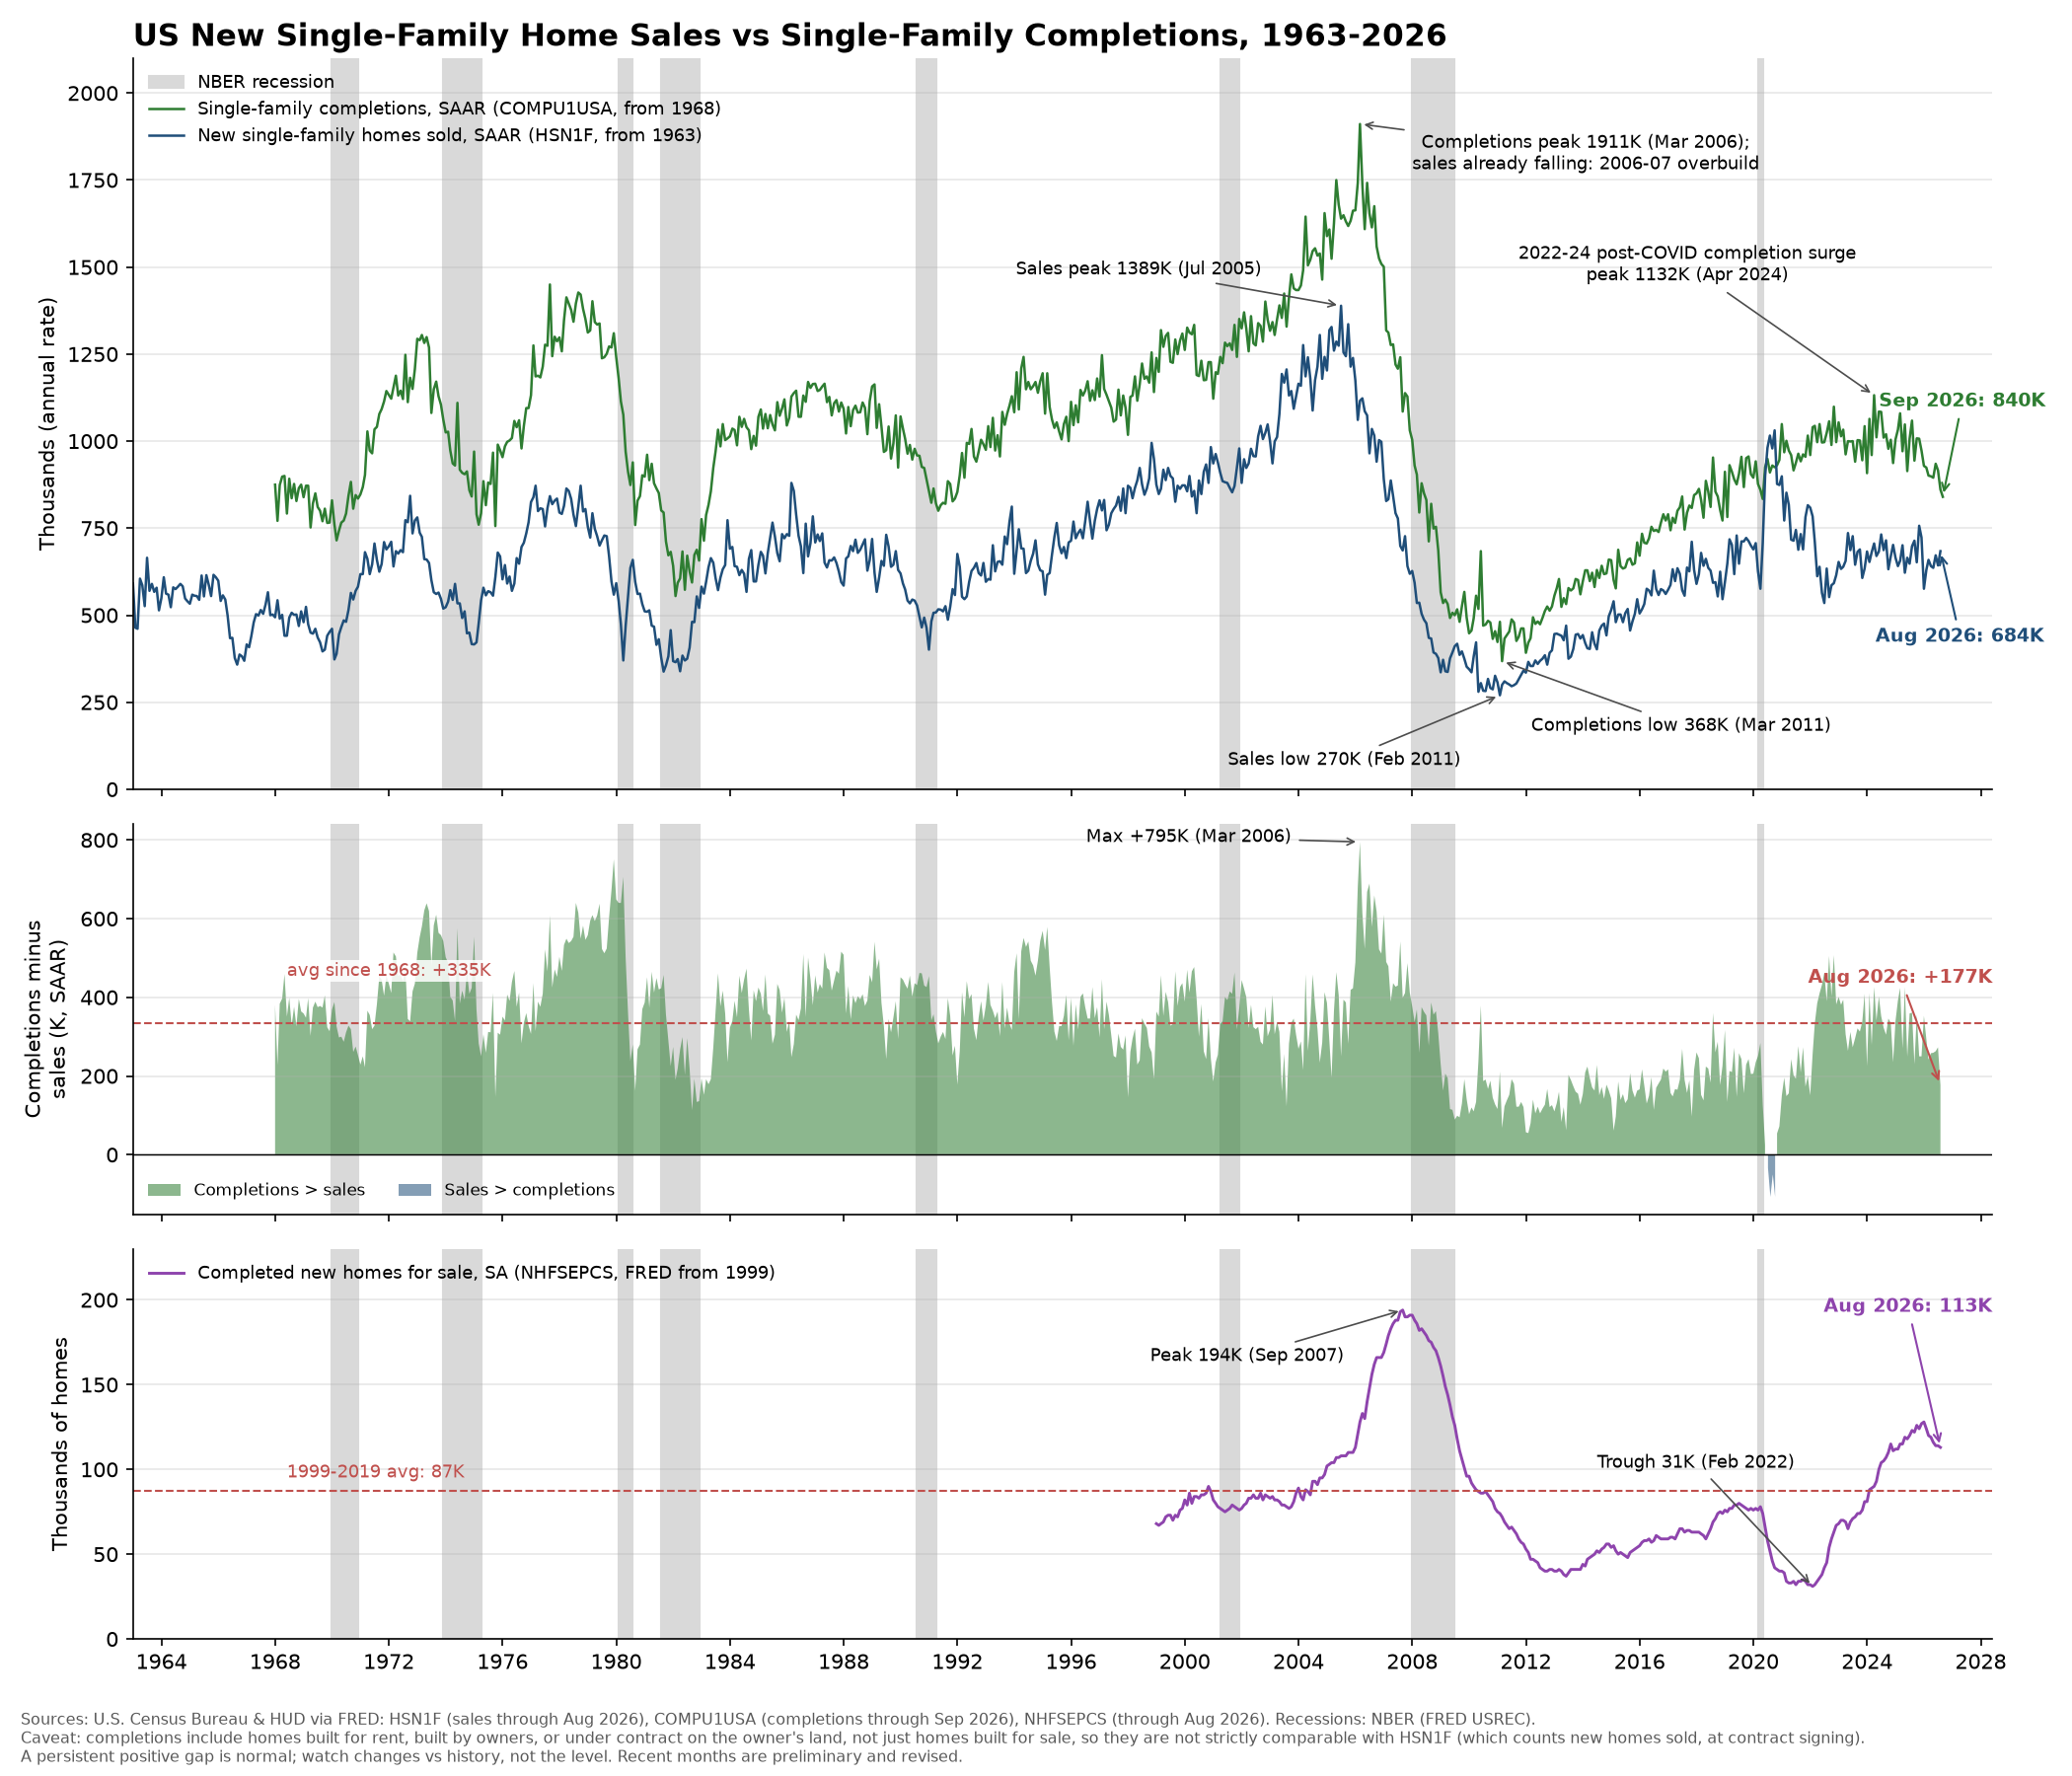
New supply is starker still: the number of new homes has fallen to 1970s levels.
None of this is likely to change soon, not until affordability improves. That means mortgage rates (7.5% today on a 30-year fixed) have to fall, home prices have to fall, or both. Home prices have started to correct, but corrections can be slow when few houses change hands.
Few areas of the market have lagged as much, or as long, as housing. And perhaps no laggard is as big: housing-related activity accounts for roughly 15% to 18% of GDP. There is contrarian appeal here: depressed prices and trough earnings among homebuilders, building-materials companies, heating and air-conditioning businesses, and the big-box, low-cost giants Home Depot and Lowe’s.
We’ve added positions and may add more if prices fall further. Cheap can get cheaper, but for us that would be welcome. These are quality businesses generating solid free cash flow even in a cold housing market, priced at low-to-mid-teens earnings multiples, so we don’t mind waiting. Their time will come. Long-term durability and the protection they offer against inflation only add to their appeal.
Other parts of the market have a similar setup, including property and casualty insurance, energy, and commodity-related stocks. There’s surprising value outside the digital world.
That doesn’t mean we’re leaving digital. We have meaningful exposure through holdings such as Nvidia, ASML, Apple, Alphabet, Amphenol, Taiwan Semiconductor, Palo Alto Networks, and other companies with direct and indirect exposure to AI, data, and cybersecurity. But how much we invest is set by each client’s objectives, not by the market’s weights.
We don’t need to put 55% of our stock holdings in technology companies. We are not running a year-to-year or quarter-to-quarter horse race against the S&P 500.
Warming up to bonds
The bond rout has been bracing, though our modest exposure to longer-term bonds has limited its effect on us. As rates rise and investors sell, bonds become more attractive. The question is whether those higher yields compensate for the risks and deliver gains after inflation.
I’ve had few strong views on bonds since the ZIRP years, when the 10-year Treasury yield fell to 0.5%, the 30-year briefly dipped below 1%, and trillions of dollars of Japanese and European bonds carried negative interest rates. Record buying at such low yields looked like return-free risk. For a time, longer-term yields sat below the market’s own long-term inflation expectations, implying a negative real (after-inflation) return if those expectations proved right.
The bond bubble burst in 2022, when longer-term bonds fell more than 30%. The losses went on to take down several banks in 2023, including Silicon Valley Bank and First Republic, and pushed others into the arms of buyers, including Hawaii’s Territorial Savings Bank.
Today, interest rates are back near their long-term averages, and this time they threaten the balance sheets of large debtors, many of whom never planned for their interest costs to double or more. Some may already know they won’t survive their next refinancing.
The U.S. government recently passed $40 trillion in debt and $1 trillion in annual interest costs. Interest is now the second-largest item in the government’s $7 trillion budget, behind only Social Security.
Interest costs will keep climbing as annual deficits add to the total debt; this year’s deficit will be about $2 trillion. Rising rates have also steepened the debt’s trajectory, especially since a growing share of it carries shorter maturities.
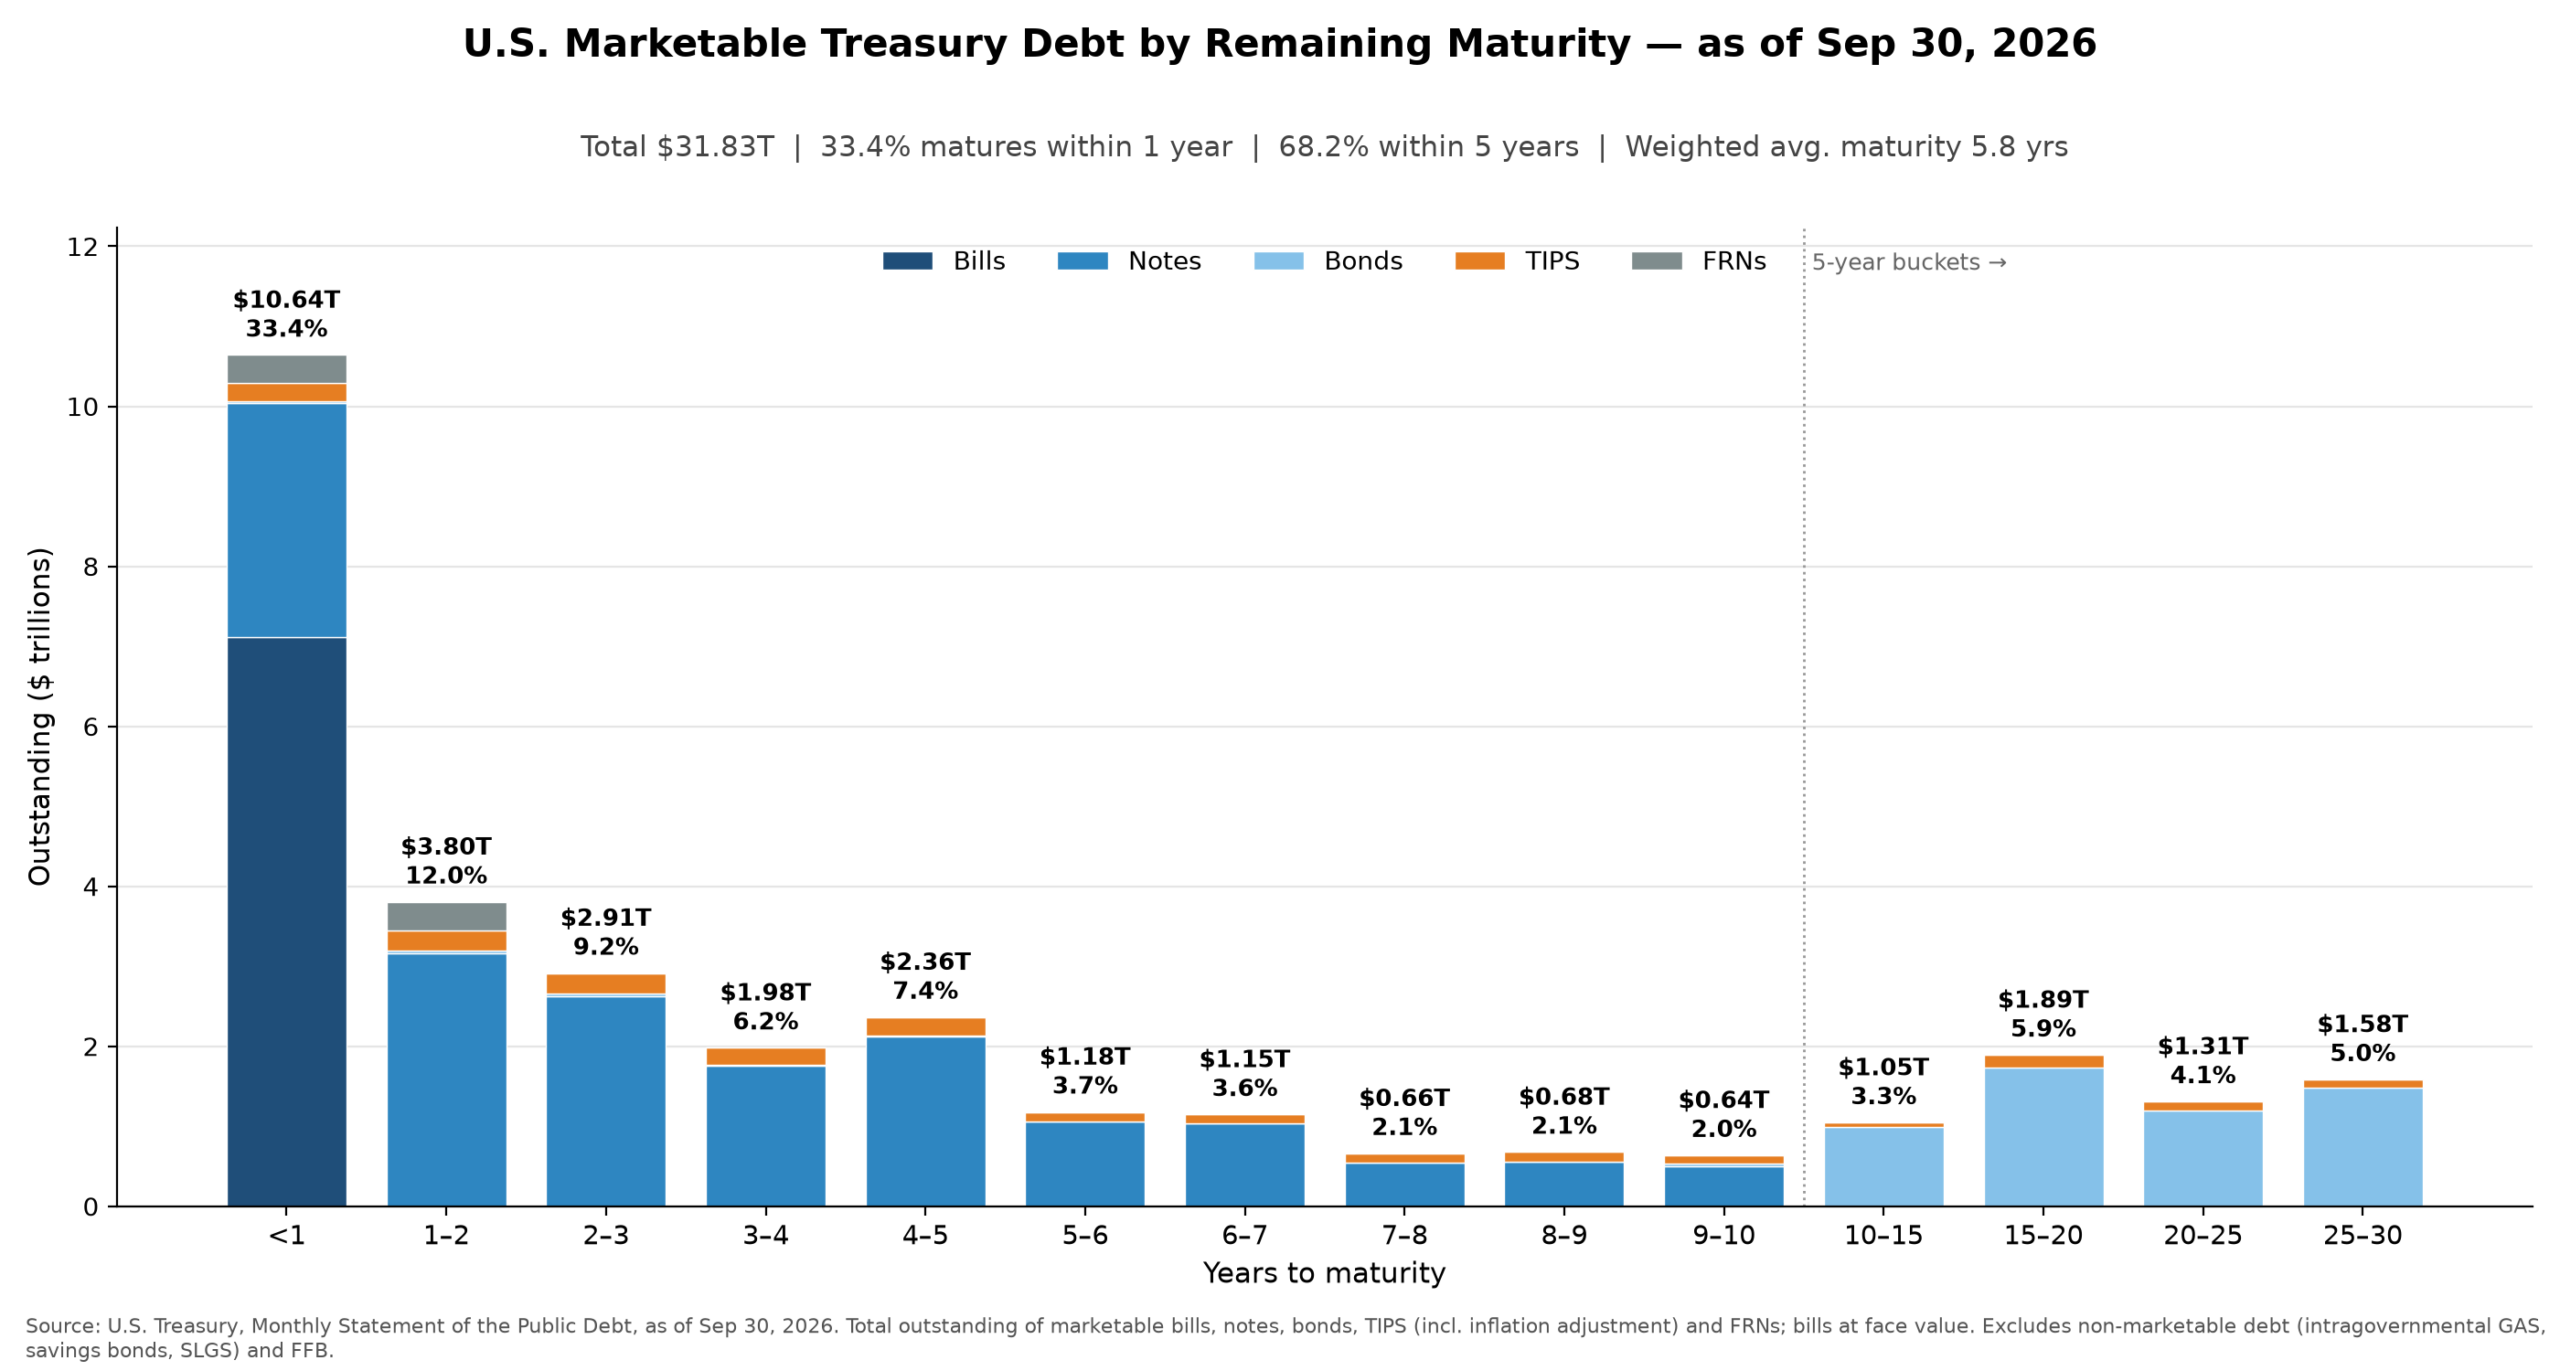
Some $10 trillion of federal debt must be refinanced within the next 12 months, and more than two-thirds matures within five years. Last month, Treasury Secretary Scott Bessent, already one of the most interventionist Treasury secretaries in history, tried to push long-term rates down with a $6 billion buyback of longer-term bonds and a plan to buy back $128 billion over the next year. Markets were unimpressed. With roughly $6 trillion of Treasurys maturing in 10 years or more, the plan amounts to about 2% of all long-term bonds, spread over a year.
Bessent’s increasing bravado hasn’t been well received. His claims the markets were operating under “bad information” while he possessed better, “asymmetric information,” were arrogant and even daft. He challenged traders to bet against him, declaring, “I am the house now.” Yields kept climbing anyway.
Fed Chair Kevin Warsh may be in a tougher spot. He succeeded Jerome Powell amid wide expectations that he would cut rates. Instead, in September the Fed raised them, with Warsh citing persistent inflation, a concern I think is correct. Warsh could be the next in a long line of Trump appointees eventually in the president’s crosshairs.
The biggest effect of higher rates may be “crowding out”: heavier government borrowing absorbs capital and pushes up rates, leaving less financing, at higher cost, for private businesses and households. We may already be seeing some of it in 7.5% mortgage rates and uncomfortably high inflation.
Ironically, for all the government’s profligacy, Treasurys only get stronger relative to other investments. The stress and chaos government causes in the economy hit nearly everything else harder. No corporation or country comes close to the U.S. government’s might, and that will remain true for a long time.
So a problem with Treasurys may actually strengthen the case for owning them. Beyond higher yields, Treasurys play a useful role in a diversified portfolio: they’re highly liquid and can gain nicely if interest rates fall.
Many corporate bonds and mortgage-related securities are callable, meaning the issuer can redeem them early and refinance when rates fall, cutting off the investor’s gains. Treasurys are not callable. Buy a 10-year Treasury and its fixed coupon is yours for the full ten years, with no risk that the government redeems it early. If market rates fall, its fixed coupon payments become more valuable than those on newly issued bonds, and its price rises.
Falling interest rates often go hand in hand with falling stocks and fading confidence in the economy. That relationship broke down when rates were near zero and the only way for yields to go was up. With rates now much higher, there’s room for them to fall again, and Treasurys can once more act as a cushion.
Non-callable bonds such as Treasurys also benefit from positive convexity. In plain English: for equal-sized moves in yield, with everything else held constant, their prices generally rise more when yields fall than they drop when yields rise.
A real example shows this best. The current 10-year Treasury pays a 4.625% coupon and matures on August 15, 2036. Today an investor can buy it for $97.50 per $100 of face value, for a yield to maturity of roughly 5%.
The chart below shows the bond’s modeled one-year total return (price change plus interest) under different interest-rate moves. Bond yields are measured in basis points: one basis point is 1/100 of 1%, so +100 basis points means rates rise one percentage point, and −200 means they fall two.
If the 10-year yield rises from 5% to 7% over the next 12 months, a substantial increase, the bond’s modeled total return is −8.3%. That’s total return, not just the change in price.
But suppose the economy weakens, stocks sell off, investors seek refuge in Treasurys, and the 10-year yield falls 200 basis points to 3%. The bond’s modeled total return would be about +20.3%.
−8.3% versus +20.3% for the same two-percentage-point move over 12 months. That’s positive convexity at work.
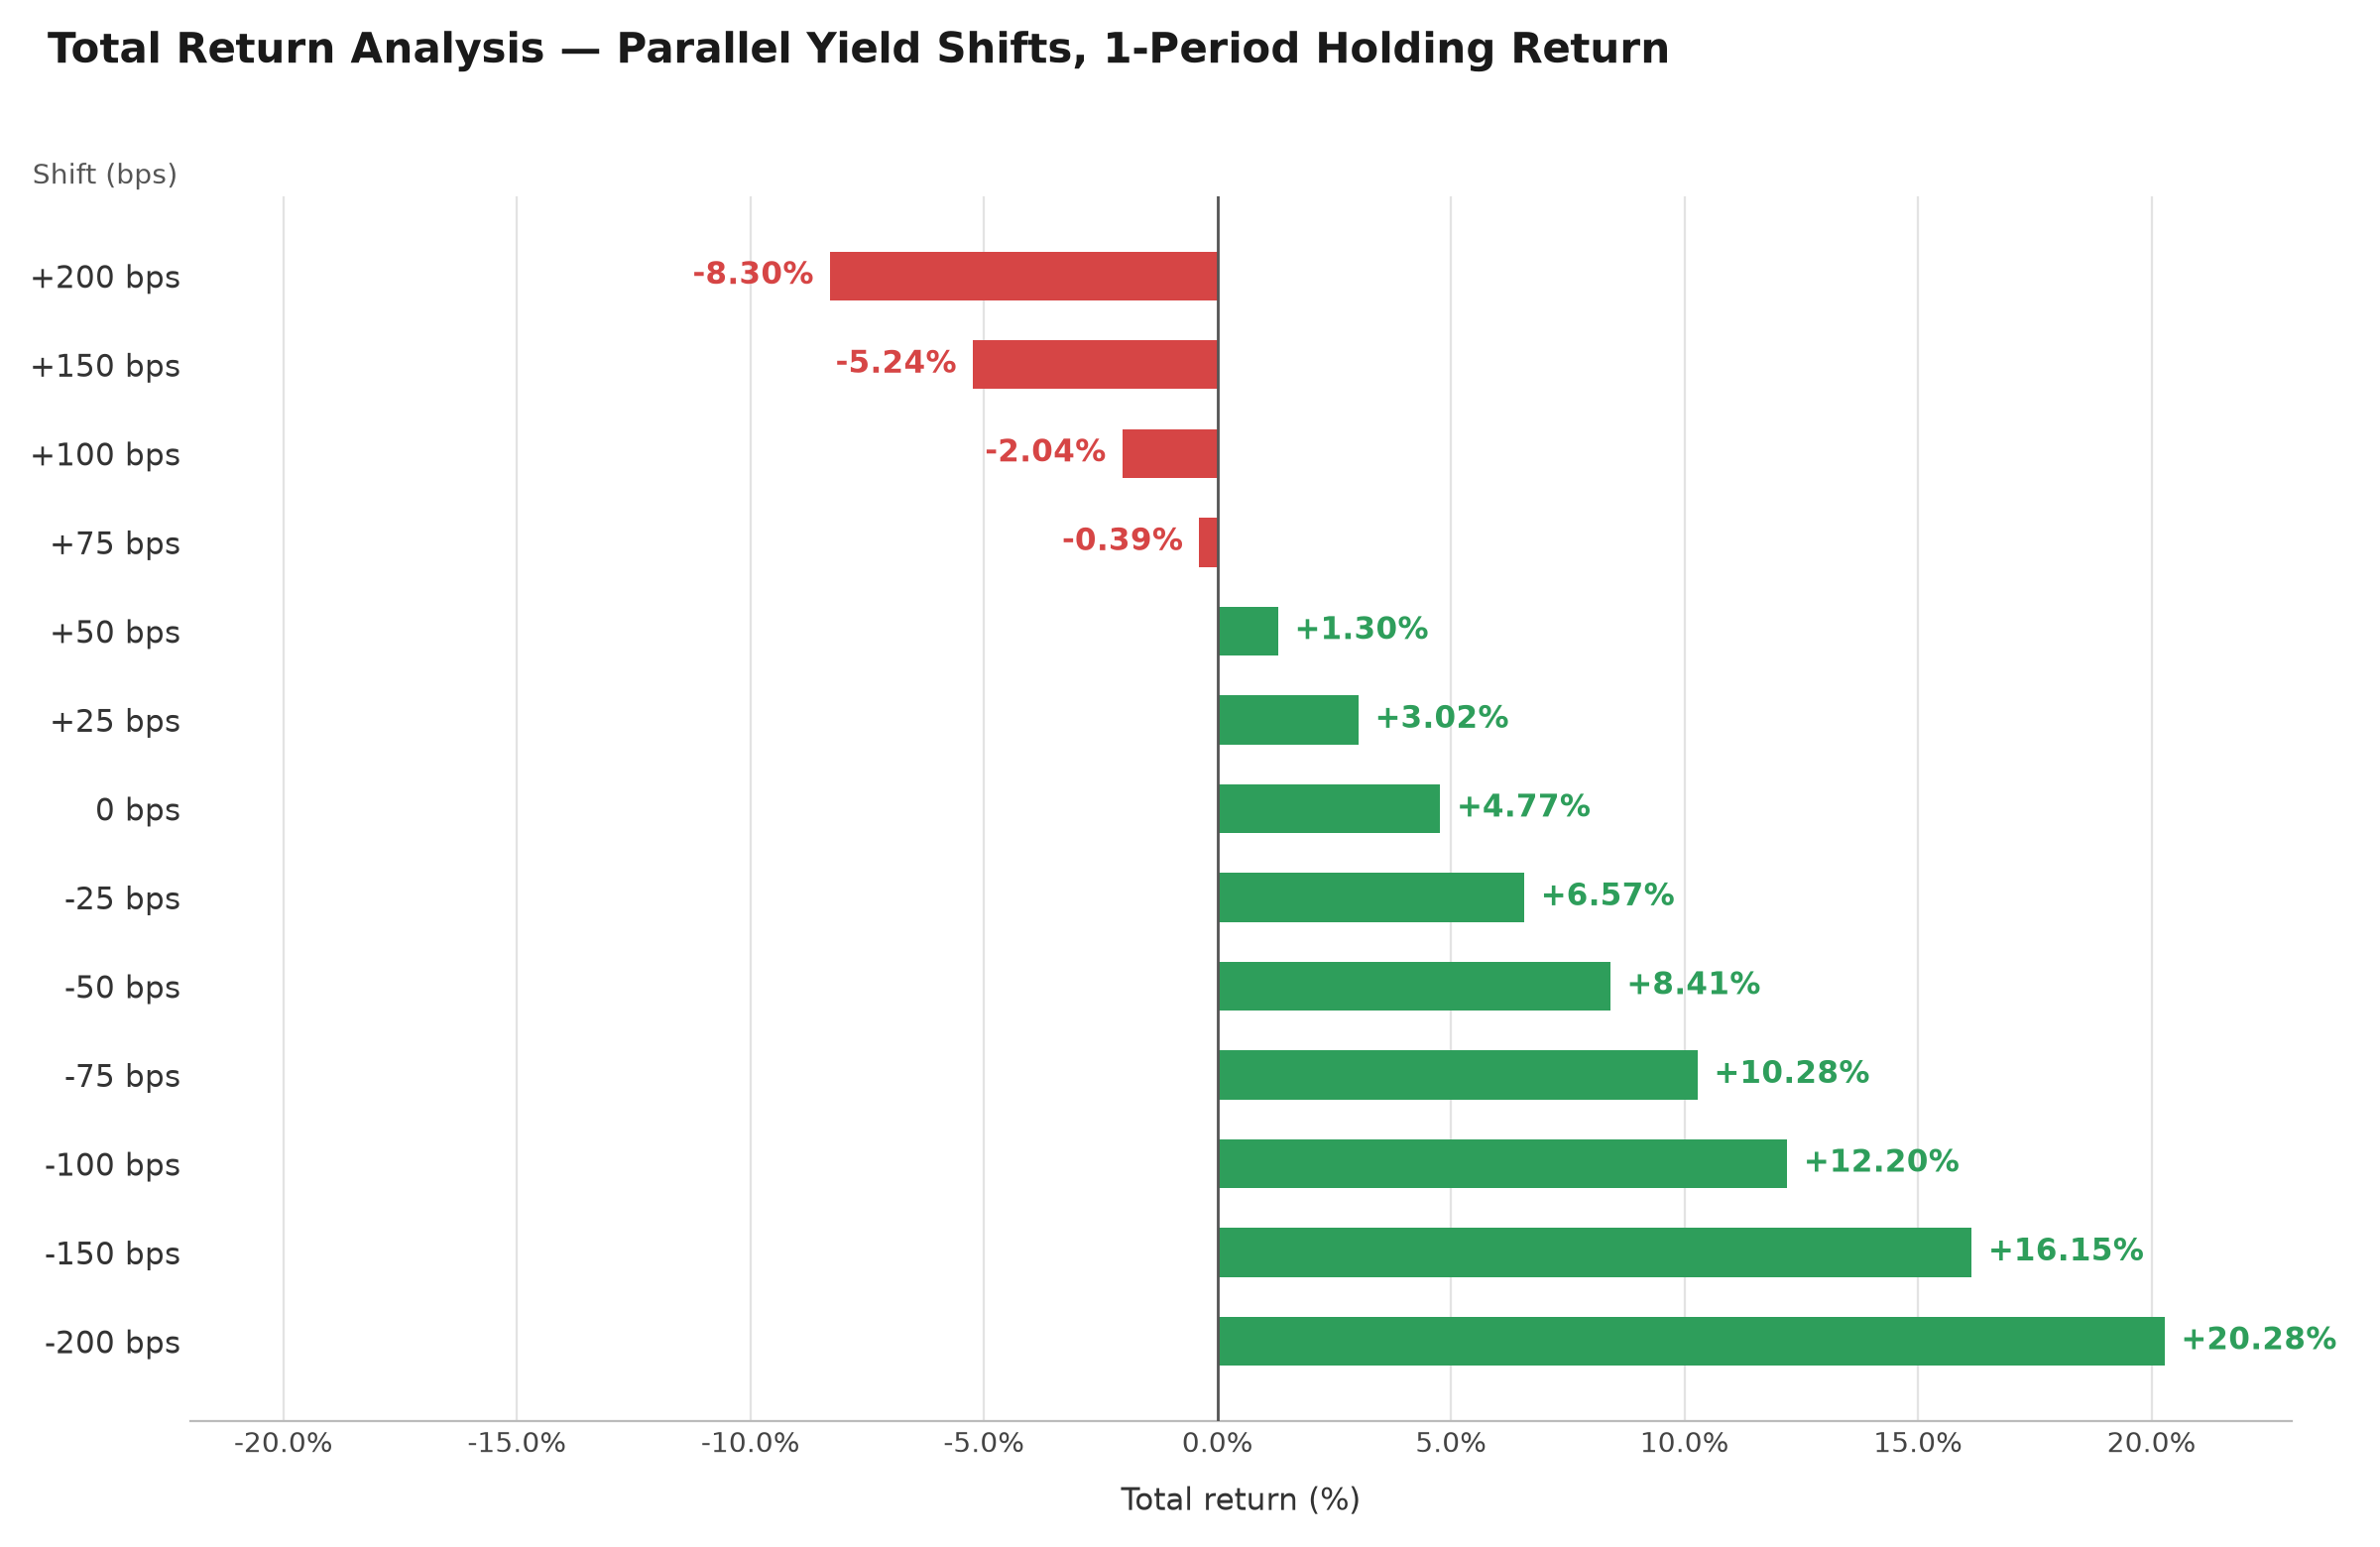
Illustration only. Assumes a starting yield of about 5%, a parallel yield change over 12 months, coupons received but not reinvested, and no taxes, fees, or transaction costs. Not a prediction of future results.
This isn’t an endorsement of Treasurys. It’s a recognition that as rates rise and prices fall, the case for holding at least some in a portfolio grows. Given how little we still hold in longer-term bonds, it’s worth watching for opportunities to add.
The “Sports Illustrated Curse” is the least serious argument for bonds but maybe the best. The Curse is simple: for athletes and markets alike, magazine covers are a bad omen, and the track record in finance is eerily consistent. The Economist recently sounded the alarm on bonds on its cover.
Since that cover, bonds have reversed. We’ll see whether the Curse holds again.
I’ll end by repeating something I feel strongly about within fixed income: among longer-term bonds, the inflation-protected kind, Treasury Inflation-Protected Securities (TIPS), are a relative bargain, especially since inflation is one of the principal risks to long-term finances.
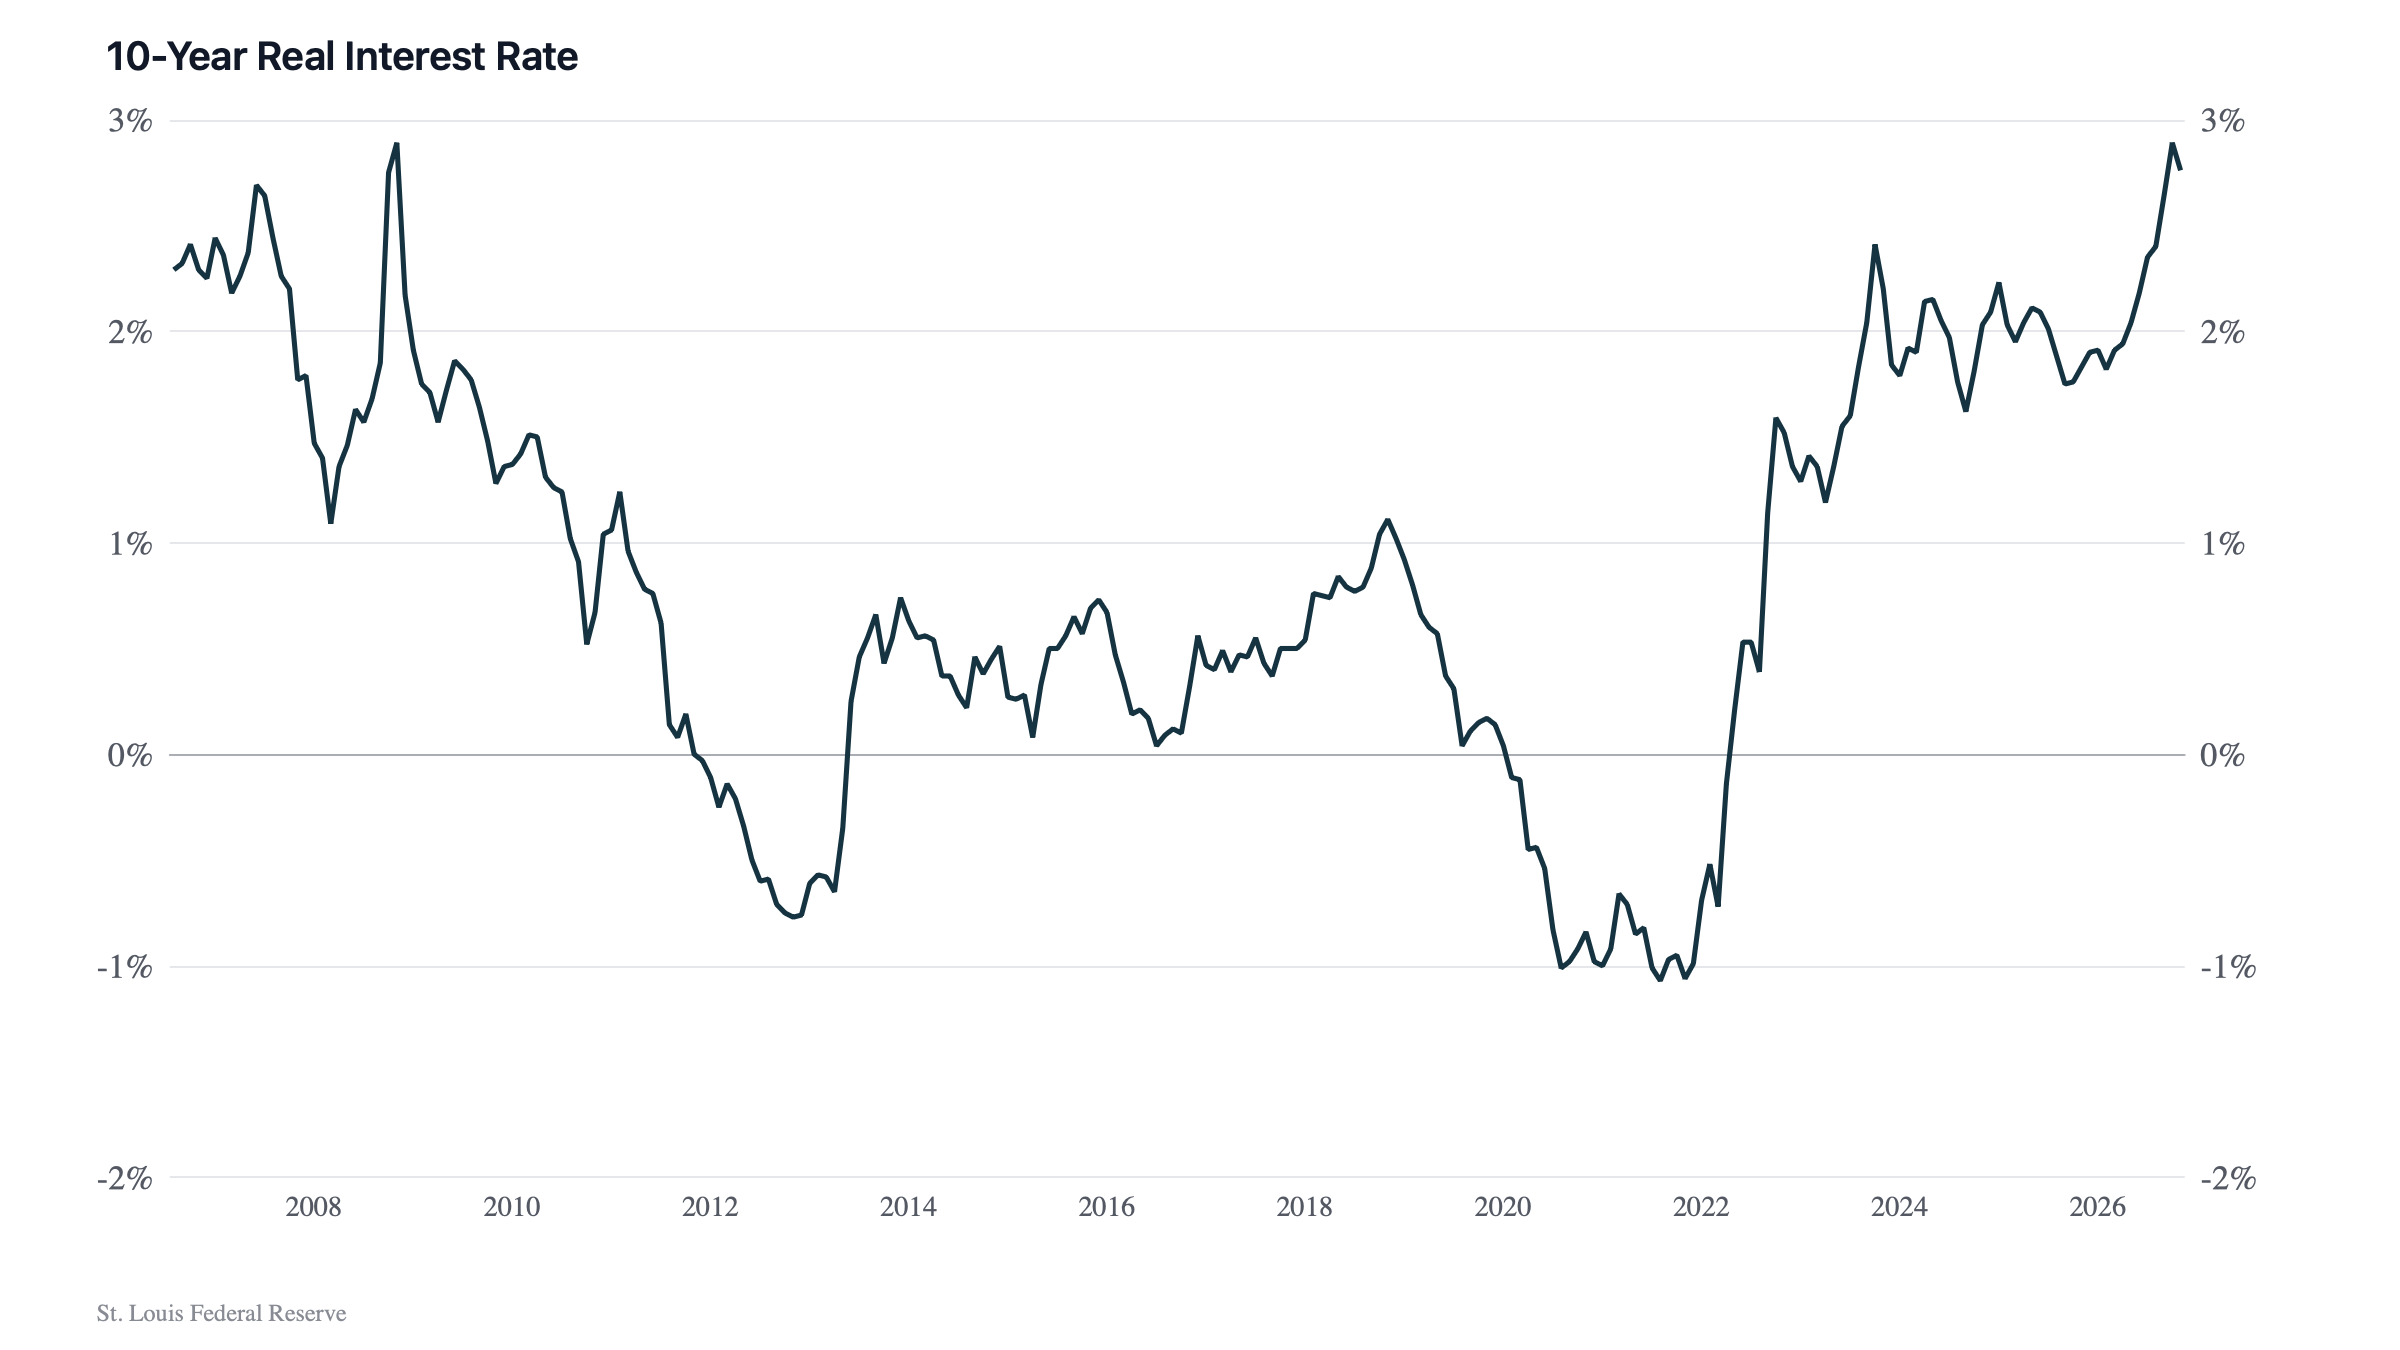
TIPS have become more attractive as interest rates have risen. Curiously, the market seems of two minds about inflation. Surveys point to inflation well above 3% over the next several years; the University of Michigan survey, for example, shows expectations of 3.5% a year over the next five years.
The money says something else. The difference in yields between regular Treasurys and TIPS shows the market’s over/under on inflation for the next five, 10, and even 30 years is about 2.25%. If inflation runs hotter than that, TIPS would outperform regular Treasurys of the same maturity, perhaps significantly.
Today investors can lock in a real yield of about 2.8% plus inflation (CPI) on 10-year TIPS, and more than 3% plus CPI on 30-year TIPS.
That may not be exciting, but having some in a diversified portfolio helps me sleep a bit better at night.
Neil Rose, CFA
1 I often wonder how many know that with the amazing run in the S&P 500 and its “total market index” facsimiles now commanding a high percentage of investment dollars in stocks—including most 401(k) dollars—has lowered their overall diversification. I’ve heard many wrongly equate “passive” stock index funds with diversification and lower overall risk. What indexing minimizes is stock picking risk versus the stock market itself, not minimizing stock market risk and the risk of loss. “Passive” stock investing is a very active bet on the stock market and its drivers (like the economy), an increasing bet on Big Tech, and maybe also a bet on lower interest rates and more prudent action from government.
The content provided in this document is for informational purposes and does not constitute a solicitation, recommendation, endorsement, or offer to purchase or sell securities. Nothing should be considered personal financial, investment, legal, tax, or any other advice. The content is information general in nature and is not an attempt to address particular financial circumstances of any client or prospect. Clients receive advice directly and are encouraged to contact their Adviser for counsel and to answer any questions. Any information or commentary represents the views of the Adviser at the time of each report and is subject to change without notice. There is no assurance that any securities discussed herein will remain in an account at the time you receive this report or that securities sold have not been repurchased. Any securities discussed may or may not be included in all client accounts due to individual needs or circumstances, account size, or other factors. It should not be assumed that any of the securities transactions or holdings discussed was or will prove to be profitable, or that the investment recommendations or decisions we make in the future will be profitable or will equal the investment performance of the securities discussed herein.
About the Author

Neil Rose, CFA, is the founder and CEO of Regency Capital Management.