
Market Contradictions Widen: A Story in 5 Charts
By Neil Rose, CFA
1. Can record P/Es and higher interest rates coexist from here?
By Shiller CAPE (or the Cyclically-Adjusted P/E Ratio), the S&P 500 is now back in the same rarefied air last seen in the dot-com bubble, and before that, 1929. Investors are paying bubble-era prices for the stock market.
Shiller CAPE Ratio of S&P 500
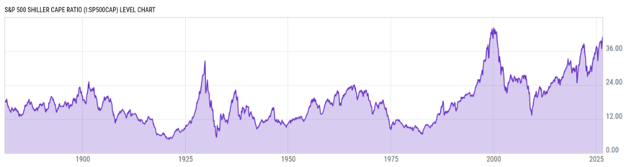
Meanwhile, interest rates have climbed recently. High P/E multiples could be vulnerable to rising interest rates from here as it gets harder to justify paying high multiples when opportunity costs rise. At some point, doing nothing and collecting more income starts to look more attractive.
U.S. Treasury 10-Year Yield
Currently: 4.47%
2. Wall Street euphoria with Main Street gloom.
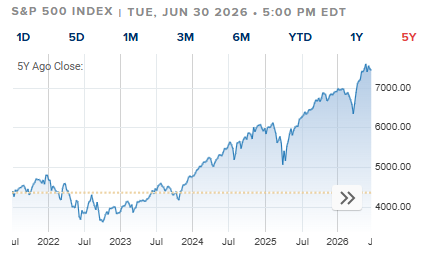
The divergence in the S&P 500 performance over the past year (up ~23%) and consumer sentiment (down 18.5%) represents one of the biggest one-year divergences in history. While sentiment readings typically read more pessimistic than what the stock market’s performance suggests, the current bifurcation is extreme. Never before have measures of household mood been this depressed versus stock market performance.
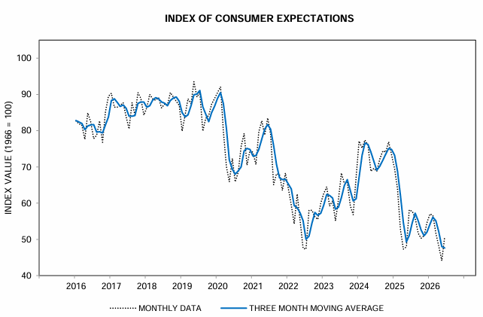
Source: University of Michigan Surveys of Consumers
One way or another, this divergence will collapse.
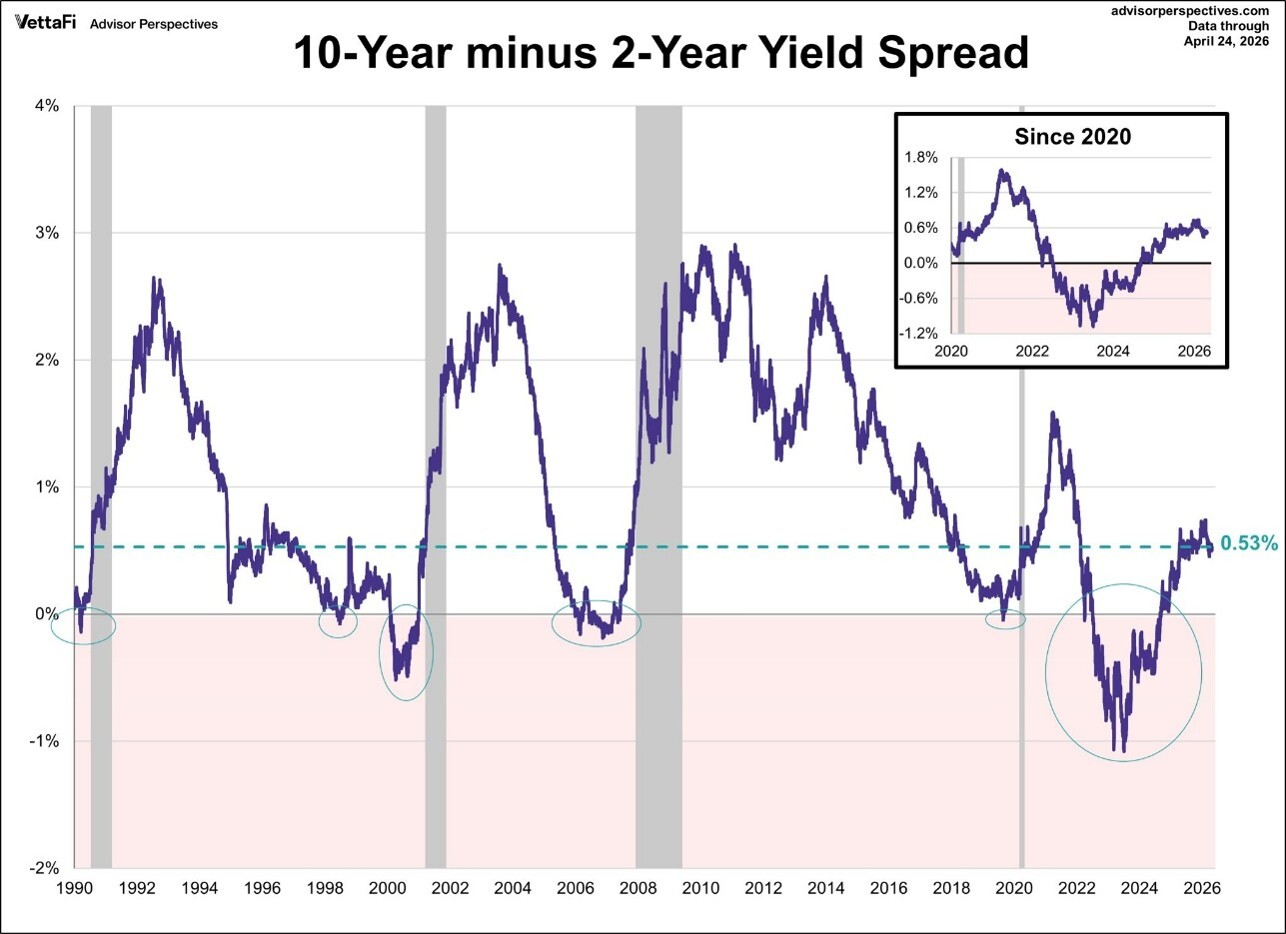
3. Wall Street euphoria with a flattening yield curve.
New Federal Reserve Chair. New talk of raising interest rates again given inflation is uncomfortably sticky. Fed watching is back, as is watching the “2/10” curve. My hunch: The 10-year Treasury yield might be the best leading economic indicator right now. Should the 10-year yield fall—or the yield curve go flat or invert—Wall Street analysts will reverse their rosy forecasts.
4. Inflation is rising; worries about inflation are falling.
U.S. Consumer Price Index YoY % Change
Last reading, April 2026: 4.25%
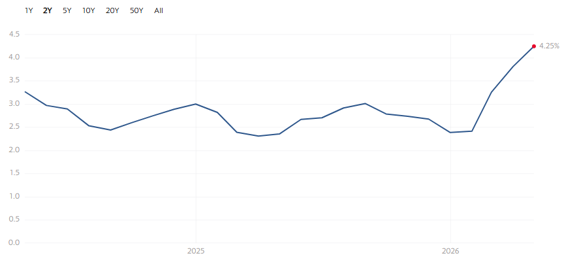
Source: Department of Labor Statistics, Multpl
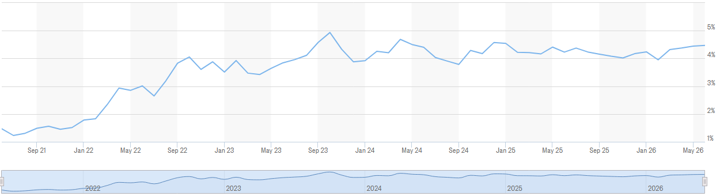
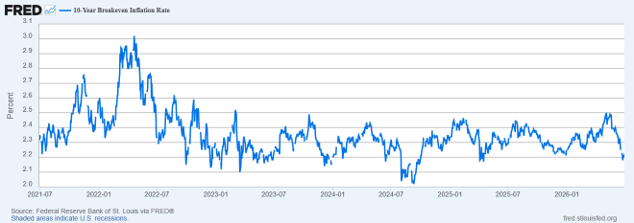
The “break-even inflation rate” shows how inflation is priced. The market’s over/under on average inflation over the next 10 years is near 2.2%. The crowd is decidedly sanguine on inflation.
(Investors, take heart: this means more income and cheaper inflation protection.)
10-Year Break-Even Inflation Rate
(The Market’s over/under on future inflation)
Of course, the direction of interest rates and inflation could simply be reflective of bullish conviction about the economy and stocks going forward—as well as confidence in the Fed’s ability to deliver the goods and in Washington’s ability to manage its soaring debt load and annual interest tab.
Either way, the market (and maybe the economy) has little room for error at these prices.
5. Can stocks’ momentum handle all the new supply?
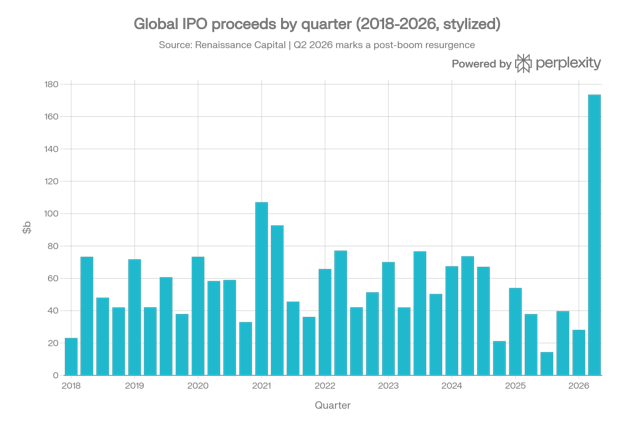
For the first time since the 2021 boom, the primary equity window is not just open but busy. Q2 delivered the biggest IPO in history, and 2026 will see two more trillion-dollar IPOs. The three largest IPOs will have occurred in 2026. A bumper crop of IPOs is not a hallmark of a stock market with legs.
About the Author
Neil Rose, CFA, is the founder and CEO of Regency Capital Management.