
The S&P 500 is up 10% year to date. The “cost” of that gain was sitting through a nearly 20% drop.
Unusual? Hardly.
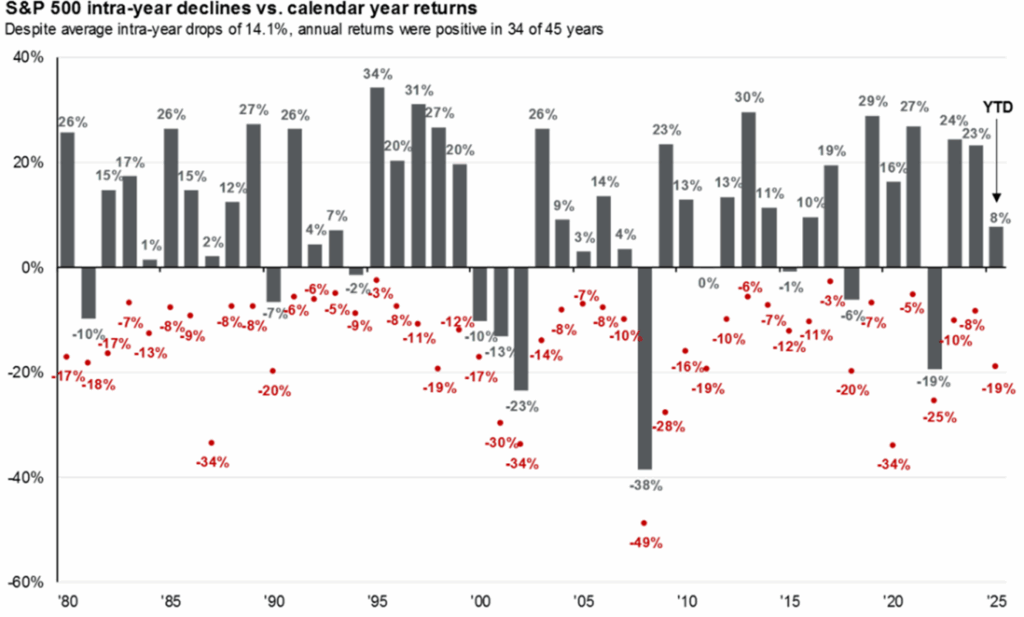
The chart below is a good reminder that the minimum cost of investing is volatility. In any particular year, one’s account value will fall. The S&P 500 sees a peak-to-trough drop of 14% in any particular year on average going back to 1980.
That means a $1,000,000 index fund dropped to $860,000, on average, at some point during the year. In 2008, that drop was to $510,000.
Worse, a drop can persist into the next calendar year or longer, so one’s ultimate peak-to-trough can be huge. Maybe this is why U.S. stocks have outperformed bonds and, yes, real estate over the long term—because it requires more discomfort.
About the Author
Neil Rose, CFA, is the founder and CEO of Regency Capital Management.